Routing Co-Pilot + Gamification
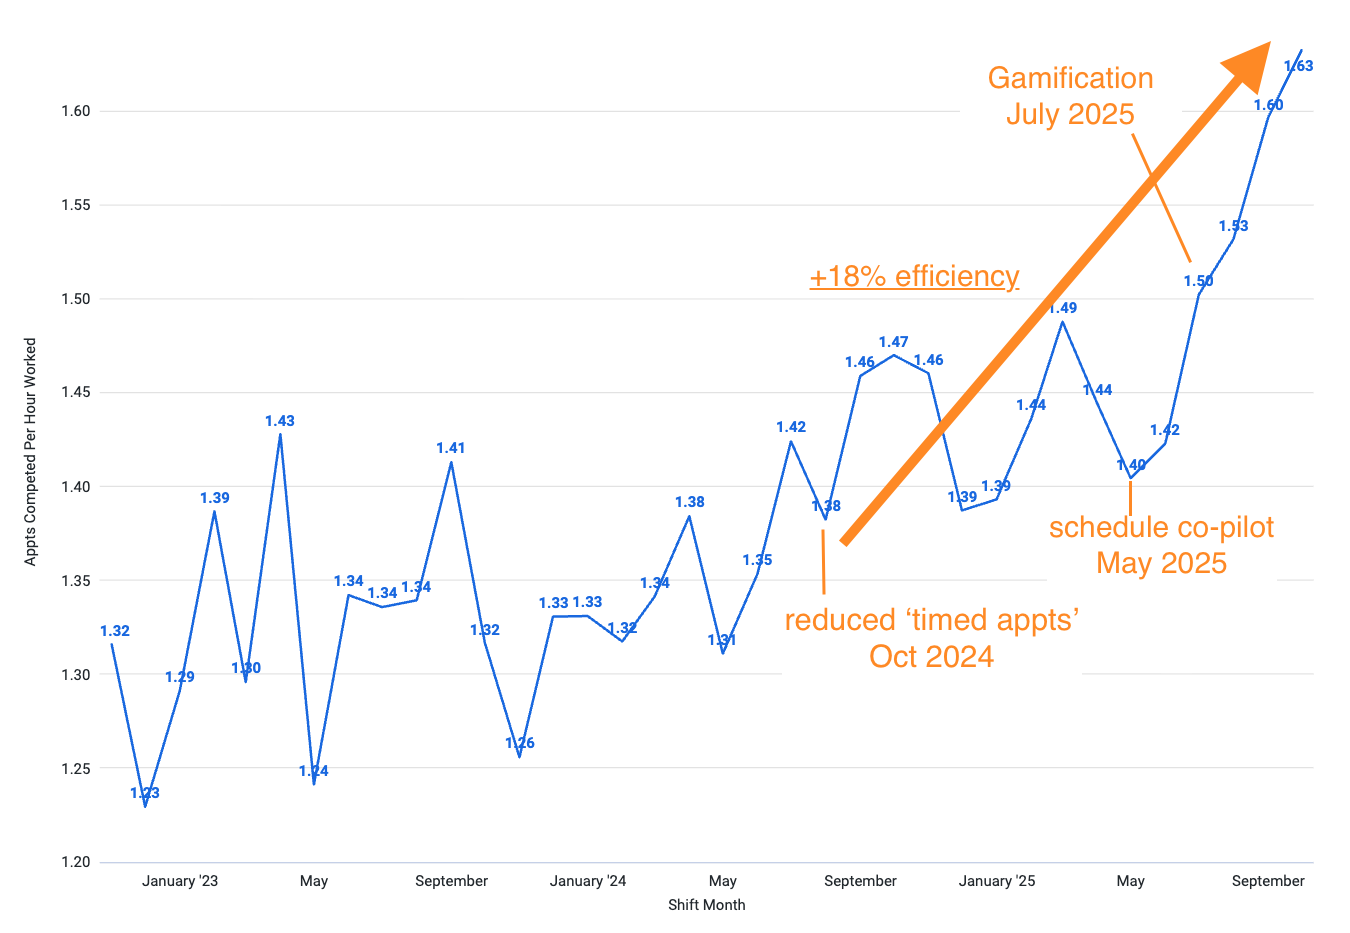
18% improvement in efficiency over the course of 10 months, resulting in $7M in savings
Context & Goal
Across 30 field offices and a highly seasonal workforce (big ramp in March, reductions in October), every branch scheduled differently. Schedulers plotted due-for-service homes on a map and hand-built “tight” clusters—but new appointments arrived all day, so even a good plan fell apart quickly. The objective was simple and measurable: increase technician efficiency, with Revenue per Hour Worked as the north star and Completed Appointments per Hour as the operational proxy. We also aimed to raise adherence to planned order (drive less), keep NPS flat or better, and give HQ enough control so the right jobs (e.g., long-overdue, bill-after-service) got done first.
Baseline Reality
Without tooling, techs frequently re-ordered stops to hit timed appointments, skipping nearby work and adding drive time. In practice this meant many routes had no in-order streak at all, and the variance across offices was high. Layer in rapid onboarding of new, lower-tenure techs each spring and you get fragile plans plus inconsistent execution.
Callout: Seasonality caveat — data between Oct–Mar is noisy; we focused our trend reads on the main season.
Scheduling Co-Pilot (May) — Standardize the Inputs
We launched a lightweight Scheduling Tool that created a central Job Pool and produced three route options per technician: Highest Scoring (overdue/BAS-weighted), Shortest Drive, and a Mixed strategy. For the first time, HQ could govern which jobs were eligible each day with clear filters (e.g., Long Overdue, Job Pool+). This didn’t “solve” routing forever—daily jobs still changed—but it reduced office-by-office drift and ensured the system sent the right work to the field.

Co-pilot Interface: worked with GMs and schedulers to adopt new scheduling tool which ensured compliance, profit, and efficiency
Gamification + Leaderboards (July) — Change Behavior in the Field
Next, we tackled behavior. The tech app gained streaks/points for completing appointments in order, live daily scores, leaderboards, and a one-tap “add closest appointment” action. Techs could see, moment-to-moment, how they were performing and had a simple, immediate way to improve. The impact was clear: the share of routes with no in-order streak dropped from ~35% to <10%, and distributions shifted toward longer streaks. For newer hires, the score turned fuzzy expectations into explicit targets; the one-tap action reduced decision fatigue.
Callout: Agency preserved — adherence was rewarded, but overrides were always allowed.
Workflow Streamlining (August) — Seconds → Minutes → Stops
We then removed small frictions that compound at volume: batch photo upload, prefilled text, and trimmed steps. At roughly 15 appointments/day, saving ~2 minutes per stop often creates just enough slack to complete one more appointment—a direct margin lift and a quieter end-of-day scramble.
Benchmarking & Regression Checks
We tracked Appointments per Hour Worked over time, adherence, and NPS. The headline curve rose from ~1.3 → ~1.6 (≈+23%). On-time arrivals improved ~+11%. NPS stayed flat, which is a win given we were moving faster (less small talk, more work completed). We piloted by office, watched the metrics weekly, and avoided over-reading winter data due to seasonality.
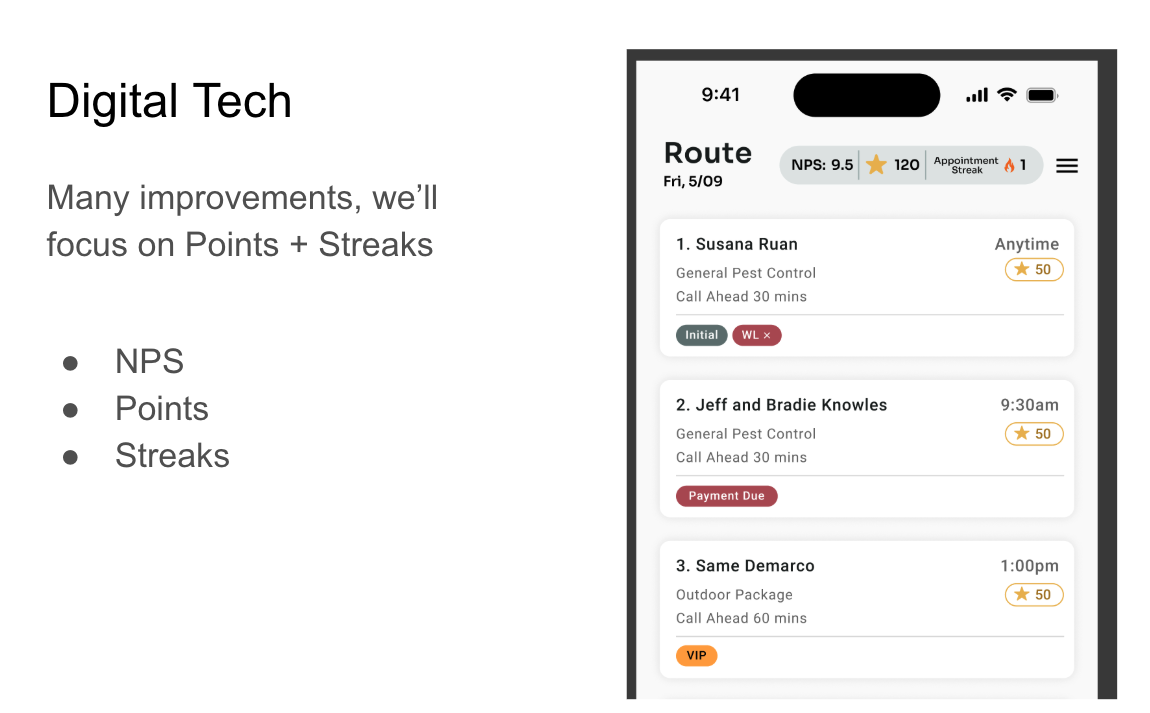
Prominence of North Star metrics and real-time feedback for techs in the field was a simple, but profound change
Outcomes (System + Behavior)
Throughput: ~1.3 → ~1.6 stops/hour (≈+23%).
Adherence: “Never in order” routes ~35% → <10%; more routes achieved longer streaks.
On-time arrivals: ~+11%.
Operational control: HQ consistently prioritized long-overdue/BAS work across 500 technicians.
Why It Worked
We blended governance (central Job Pool) with in-the-moment incentives (scores, streaks) and practical autonomy (one-tap “closest appointment,” optional overrides). Techs knew what good looked like and had a simple action to get there, while HQ ensured the right work flowed into every route. The result was a system that was faster, fairer, and stickier—not just a better plan at 7 a.m., but better decisions all day long.
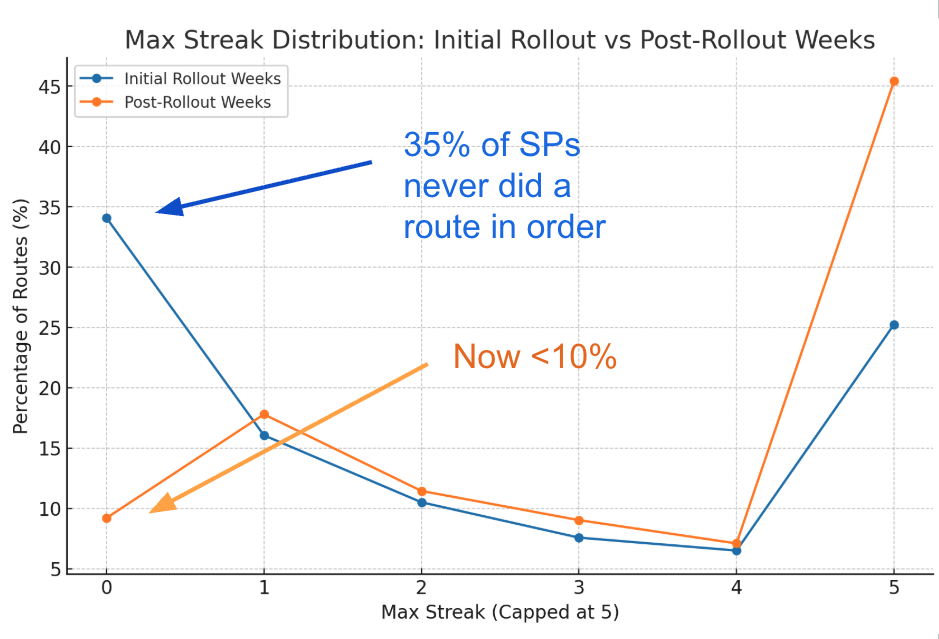
Before Streaks, 35% of all routes were never done in order, after Streaks, that number dropped and stayed below 10%